From Tangible to Intangible: The Evolution of Global E-commerce in the Digital Age
Ecommerce: The Difference between Physical and Digital Goods
As the digital economy continues to grow, so do non-tangible products. Often, when discussing ecommerce online, the focus is solely on selling physical goods. However, it is important to distinguish between the two domains of selling physical products and digital products or services because they have entirely different business models. Physical products require inventory and storage, as well as relying on certain logistics. Platforms like Shopify have built a whole ecosystem to support small business owners in selling their products, while Etsy offers a platform for selling artisanal products from the comfort of one's own home. Physical products also face geographical challenges when sold internationally; the recent example of Brexit causing complicated customs regulations has significantly impacted many small online retailers' businesses. I have written more about this issue here.
Selling digital products and services has become much easier online. In the past, during the early 2000s, not many people would have been willing to pay for online courses, excel templates, or ebooks because payment systems were not available and these types of digital products were not widely offered. However, over the last decade, there has been a significant shift in this trend as online courses and templates for various services (such as Notion) have emerged as potential sources of revenue.
The End of Abundance? The Unsustainable Hunger of Large Language Models

Artificial intelligence models are like insatiable giants, constantly needing to grow in size in order to produce better results. This is particularly true for large language models (LLM) such as ChatGPT, Claude, or LLama. While not all AI models need to be large, these language models require billions of lines of text to function effectively. Openai has not disclosed the exact source material used for their ChatGPT models, but experts speculate that it includes a vast amount of publicly available information from the internet as well as books and news articles. This has led to legal disputes, such as the New York Times suing Openai. The larger and more diverse the input of text, the stronger the model will be. This is why ChatGPT excels in broader topics with extensive content available, but may struggle in more specialized subjects. Additionally, much of human knowledge is not easily quantifiable or recorded, which is often overlooked amidst the hype surrounding large language models.
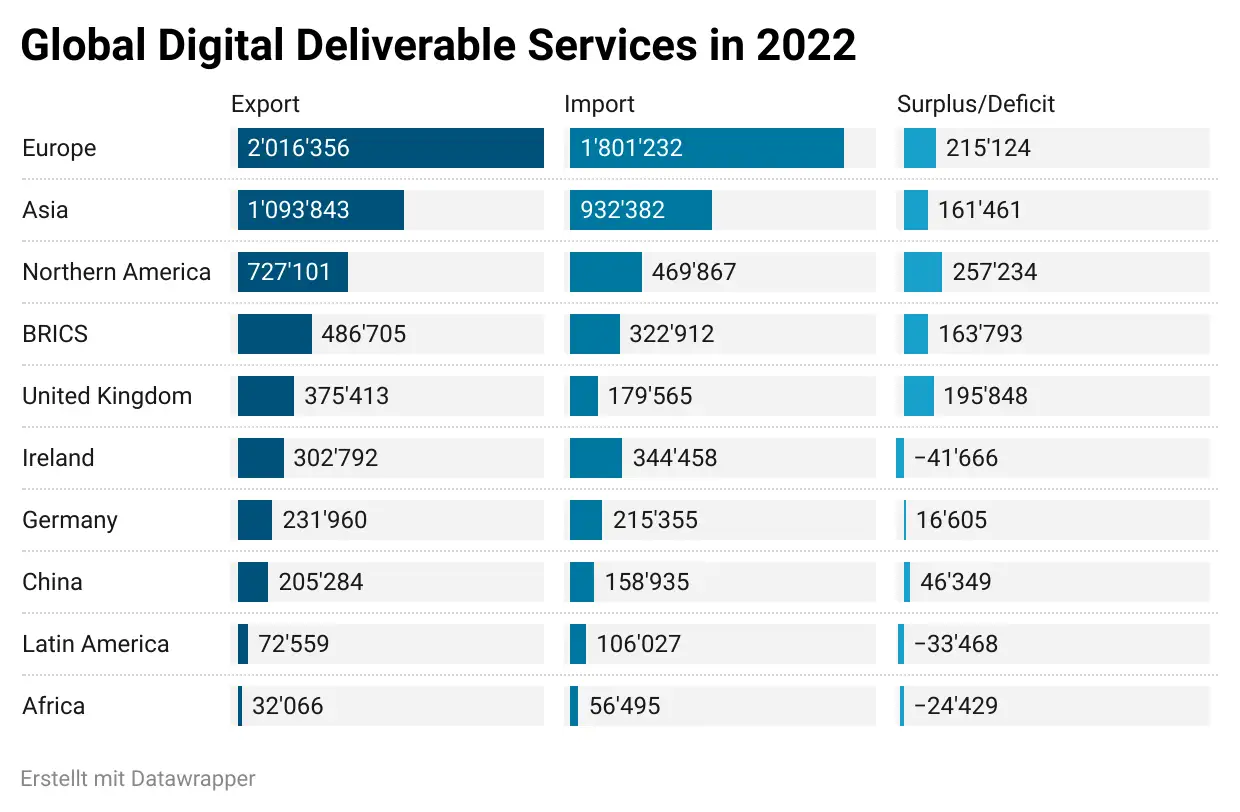
India's cashless transition and the role of the public sector
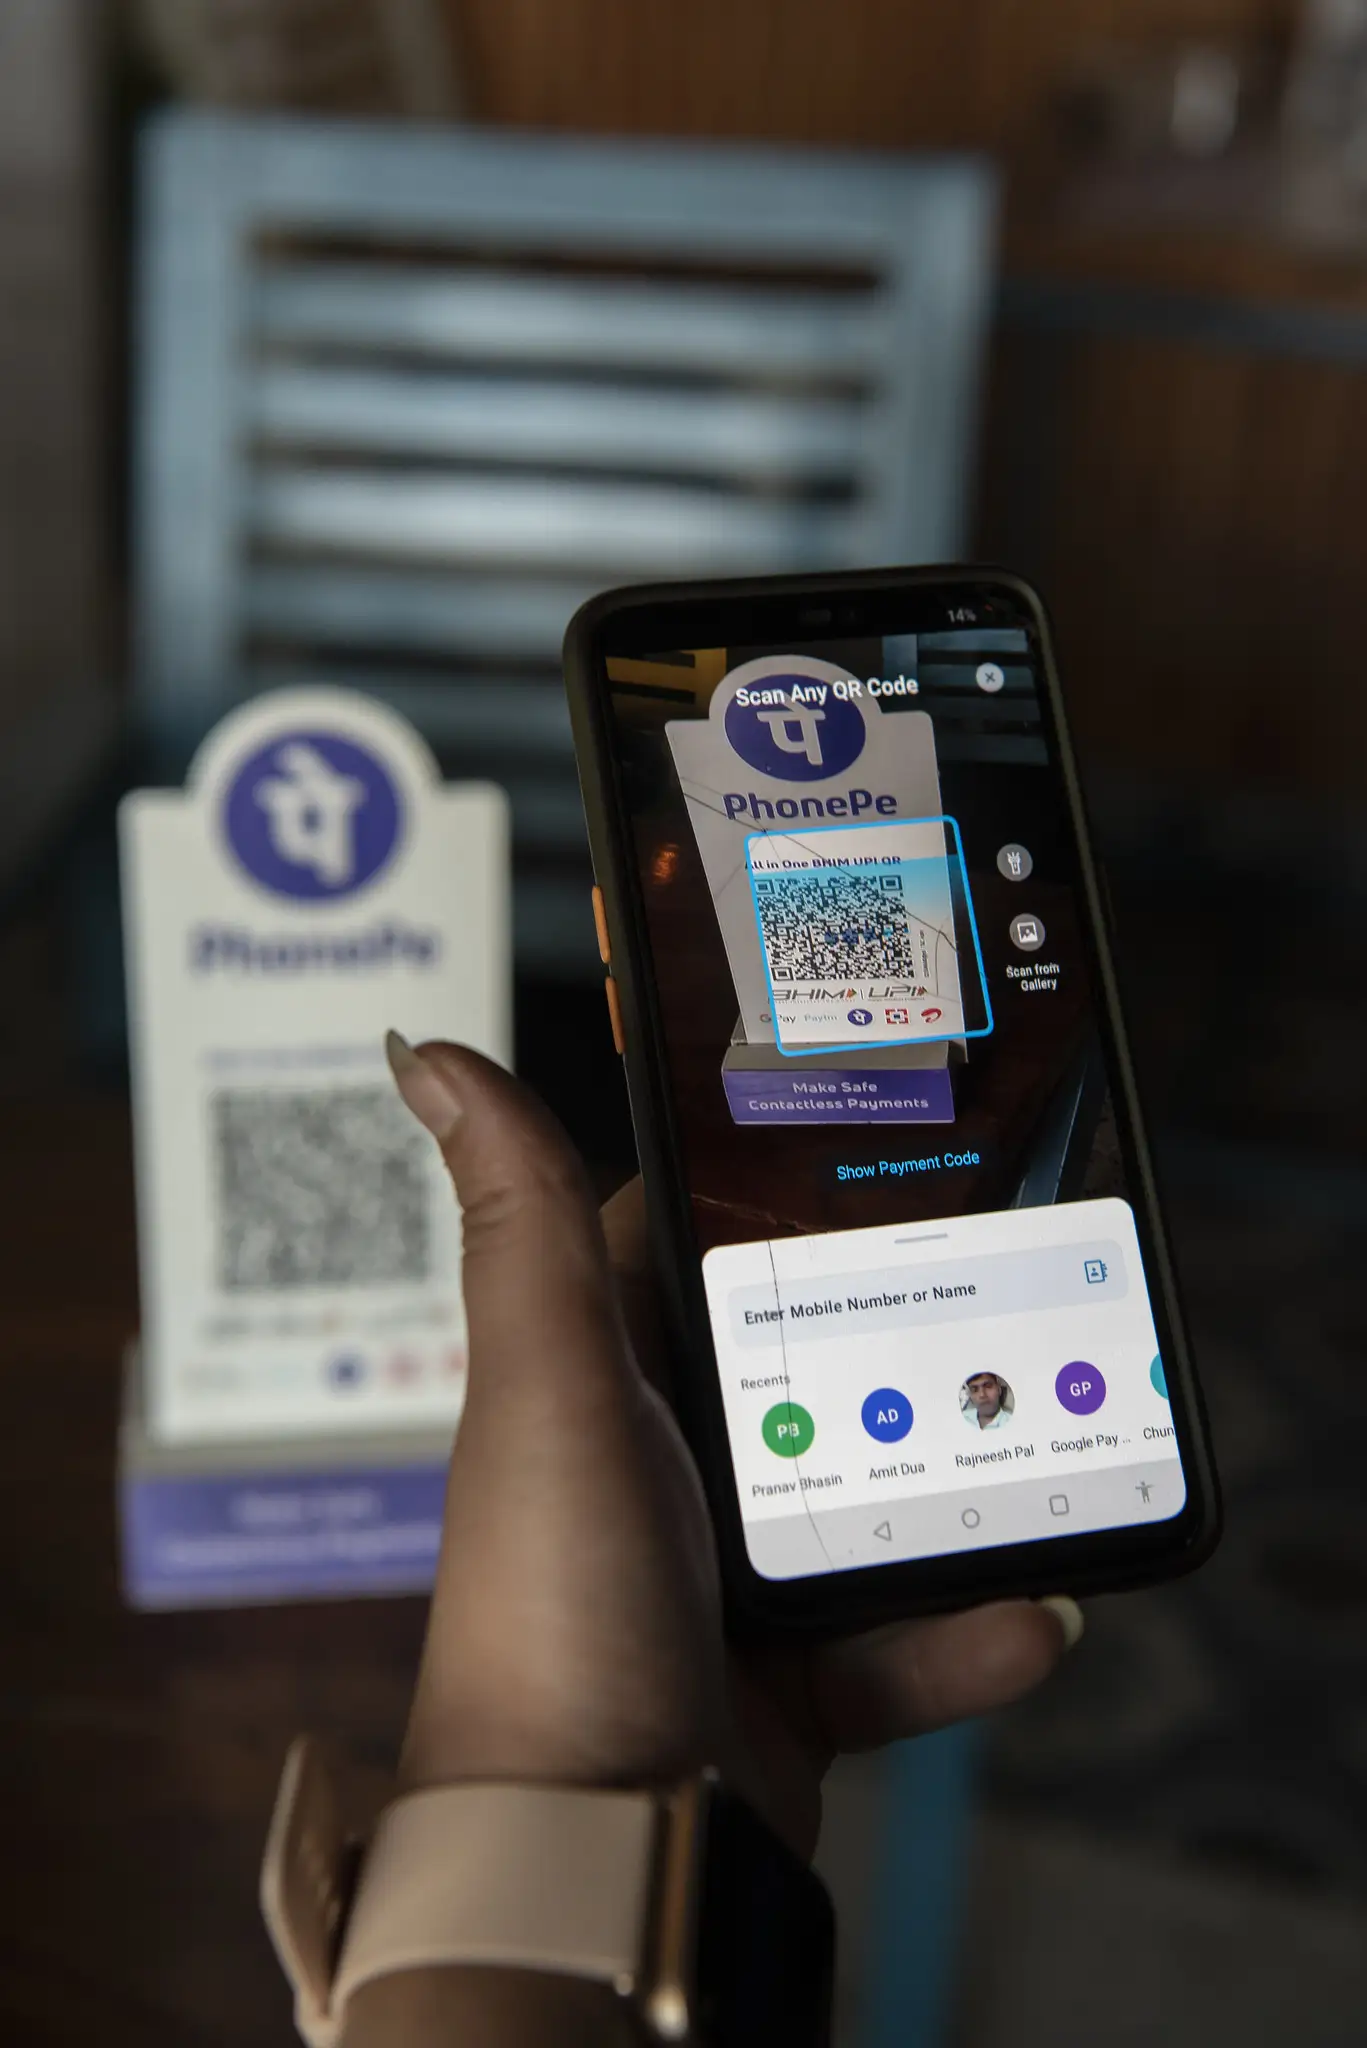
The transformation of India's economy from cash reliance to digital transactions marks a remarkable departure from trends in Europe and the USA.
As recently as 2019, cash was king in India, with 70% of all trade turnover conducted in banknotes. Fast forward to just three fours later, and this figure has dramatically dropped to 27%. This drastic shift means that now, two out of three payments in India are digital—a significant change for a country where only 20% of the population used the internet in 2018, according to the World Bank.
This contrasts sharply with other nations. While China leads the charge toward a cashless future, Japan and the EU still see a substantial portion of transactions in cash, at 60% and around 50%, respectively. (Source)
Catalysts Behind Digital Payment Adoption
Key to this digital surge is the proliferation of mobile phones and affordable mobile internet. Jio Platforms, for example, cut data costs by 95% since 2013, boosting Indian data consumption twentyfold.